Go性能分析
Go 提供了 pprof 工具,可以用来做性能分析。pprof 可以读取分析样本的集合,并生成报告以可视化并帮助分析数据。
如何生成分析样本
runtime/pprof:采集程序的运行数据进行分析,通过调用如runtime.StartCPUProfile或runtime.StopCPUProfile等 API 生成分析样本。主要用于本地测试。net/http/pprof:采集 HTTP Server 的运行时数据进行分析,通过 HTTP 服务获取 Profile 分析样本,底层还是调用的runtime/pprof。主要用于服务器端测试。go test: 通过go test -bench=. -cpuprofile cpuprofile.out… 生成分析样本,主要用于本地基准测试。
如何查看分析报告
导入 pprof
只需要 import _ "net/http/pprof" 就可以导入 pprof。
1 | package main |
查看分析样本
访问 http://localhost:6060/debug/pprof/ 就可以查看分析样本。pprof 包括了一下几个子页面:
- cpu(CPU Profiling):
<ip:port>/debug/pprof/profile?seconds=60,seconds 默认是 30s,表示等待时间 - block(Block Profiling):
<ip:port>/debug/pprof/block,查看导致阻塞同步的堆栈跟踪 - goroutine:
<ip:port>/debug/pprof/goroutine,查看当前所有运行的 goroutines 堆栈跟踪 - heap(Memory Profiling):
<ip:port>/debug/pprof/heap,查看活动对象的内存分配情况 - mutex(Mutex Profiling):
<ip:port>/debug/pprof/mutex,查看导致互斥锁的竞争持有者的堆栈跟踪 - threadcreate:
<ip:port>/debug/pprof/threadcreate,查看创建新 OS 线程的堆栈跟踪 - trace:
<ip:port>/debug/pprof/trace?seconds=20,下载 20 秒的 trace 记录
这些分析样本可以直接在终端查看:
1 | $ go tool pprof http://localhost:6060/debug/pprof/profile?seconds=60 |
flat:给定函数上运行耗时flat%:同上的 CPU 运行耗时总比例sum%:给定函数累积使用 CPU 总比例cum:当前函数加上它之上的调用运行总耗时cum%:同上的 CPU 运行耗时总比例
在 web 中查看
也可以在 web 页面中查看,比如上面的示例,Saved profile in /Users/xxx/pprof/pprof.samples.cpu.002.pb.gz
生成了一个 profile 文件,执行 go tool pprof -http=":8081" <your path>/pprof.samples.cpu.002.pb.gz,就可以访问 http://localhost:8081
来查看。
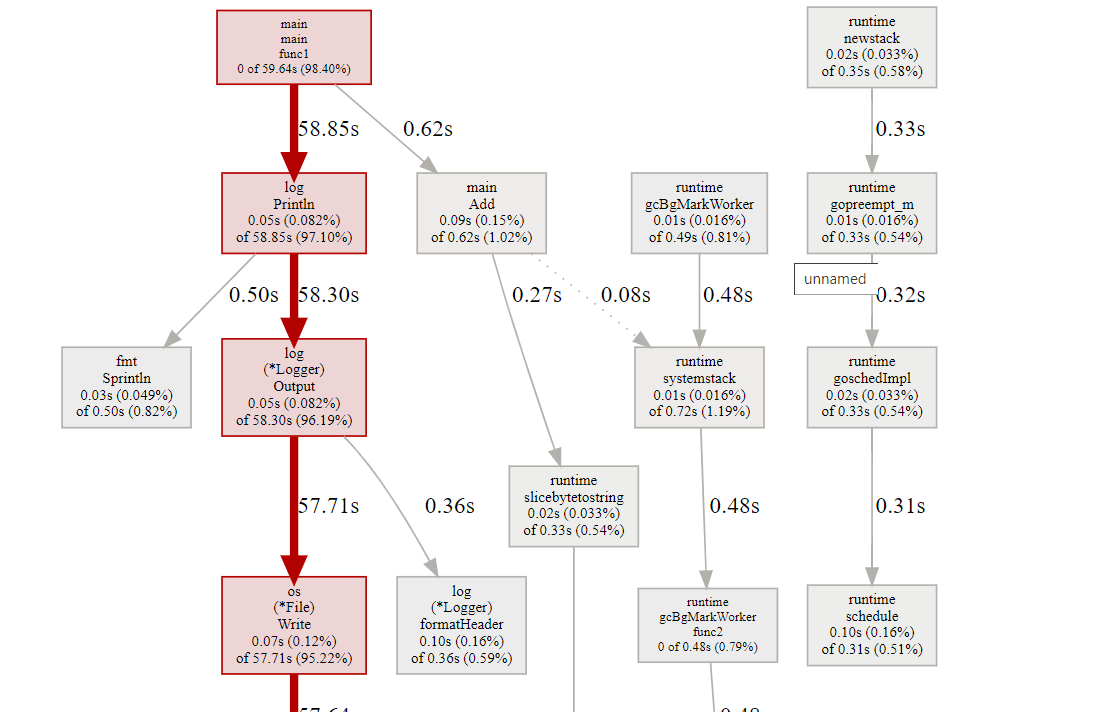
框越大,线越粗代表它占用的时间越大。
火焰图(Flame graph):
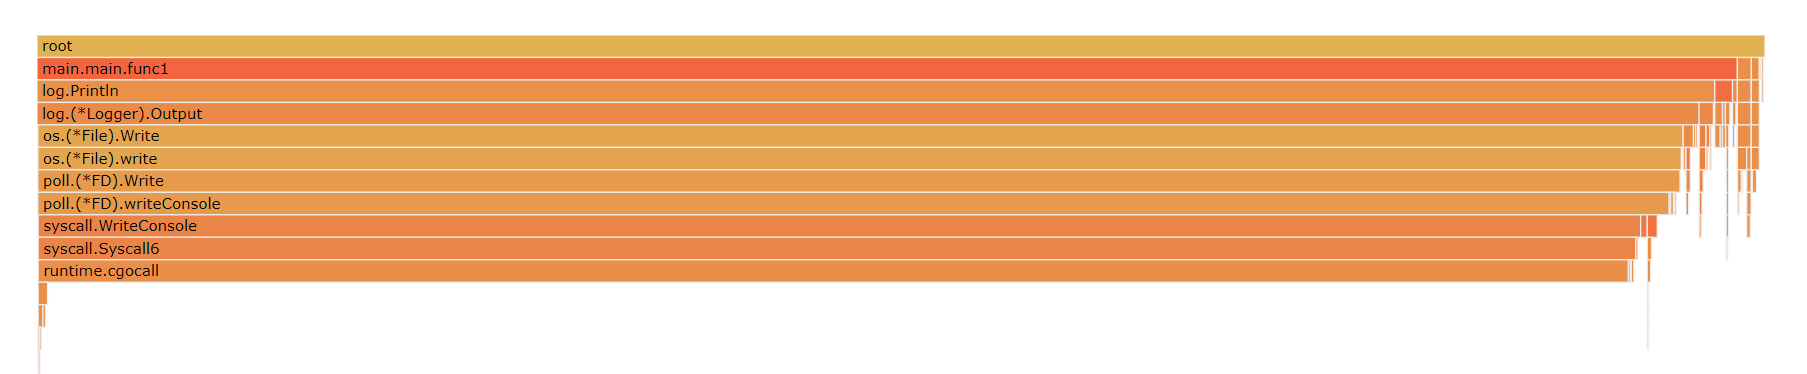
调用顺序由上到下,每一块代表一个函数,越大代表占用 CPU 的时间越长。
还可以查看 Top,Peek,Source 等。能够更方便、更直观的看到 Go 应用程序的调用链、使用情况等。
如果碰到 Could not execute dot; may need to install graphviz.,需要先安装 graphviz。
其他 heap,goroutine 等 profile 文件都可以使用上面的方式查看。
Trace
golang 的 GC 是很容易被忽视的性能影响因素。本地 benchmark 测试,由于时间较短,占用内存较少。一般不会触发 GC。线上 GC 问题定位有可以在
线上程序中添加 net/http/pprof,然后可以运行下面的命令:
1 | curl http://ip:port/debug/pprof/trace?seconds=20 > trace.out |
下载 20 秒的 trace 记录。通过 go tool trace trace.out 会打开一个 web 页面,可以查看 trace 信息。
- View trace:查看跟踪
- Goroutine analysis:Goroutine 分析
- Network blocking profile:网络阻塞概况
- Synchronization blocking profile:同步阻塞概况
- Syscall blocking profile:系统调用阻塞概况
- Scheduler latency profile:调度延迟概况,可以在这里查看整体的调用开销情况。
- User defined tasks:用户自定义任务
- User defined regions:用户自定义区域
- Minimum mutator utilization:最低 Mutator 利用率
如果 View trace 打不开,报错 tr is not defined,看这里。
如果提示 Trace Viewer is running with WebComponentsV0 polyfill, and some features may be broken. As a workaround, you may try running chrome with “–enable-blink-features=ShadowDOMV0,CustomElementsV0,HTMLImports” flag. See crbug.com/1036492。可以到 chrome 安装目录执行
.\chrome.exe –new-window –enable-blink-features=ShadowDOMV0,CustomElementsV0,HTMLImports,在打开 trace 页面。
Goroutine analysis
进入 Goroutine analysis,可以看到程序运行过程中,每个函数块有多少个有 Goroutine 在跑,并且每个 Goroutine 的运行开销。
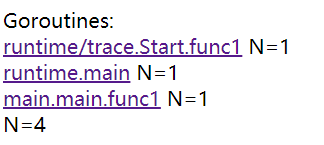
3 个 goroutine,分别是 runtime.main、runtime/trace.Start.func1、main.main.func1。点击进去查看 goroutine 具体做了些什么。

- Execution Time,执行时间
- Network Wait Time,网络等待时间
- Sync Block Time,同步阻塞时间
- Blocking Syscall Time,调用阻塞时间
- Scheduler Wait Time,调度等待时间
- GC Sweeping GC,GC 清扫时间
- GC Pause GC,GC 暂停时间
还可以把 Graph 下载下来分析。
View trace
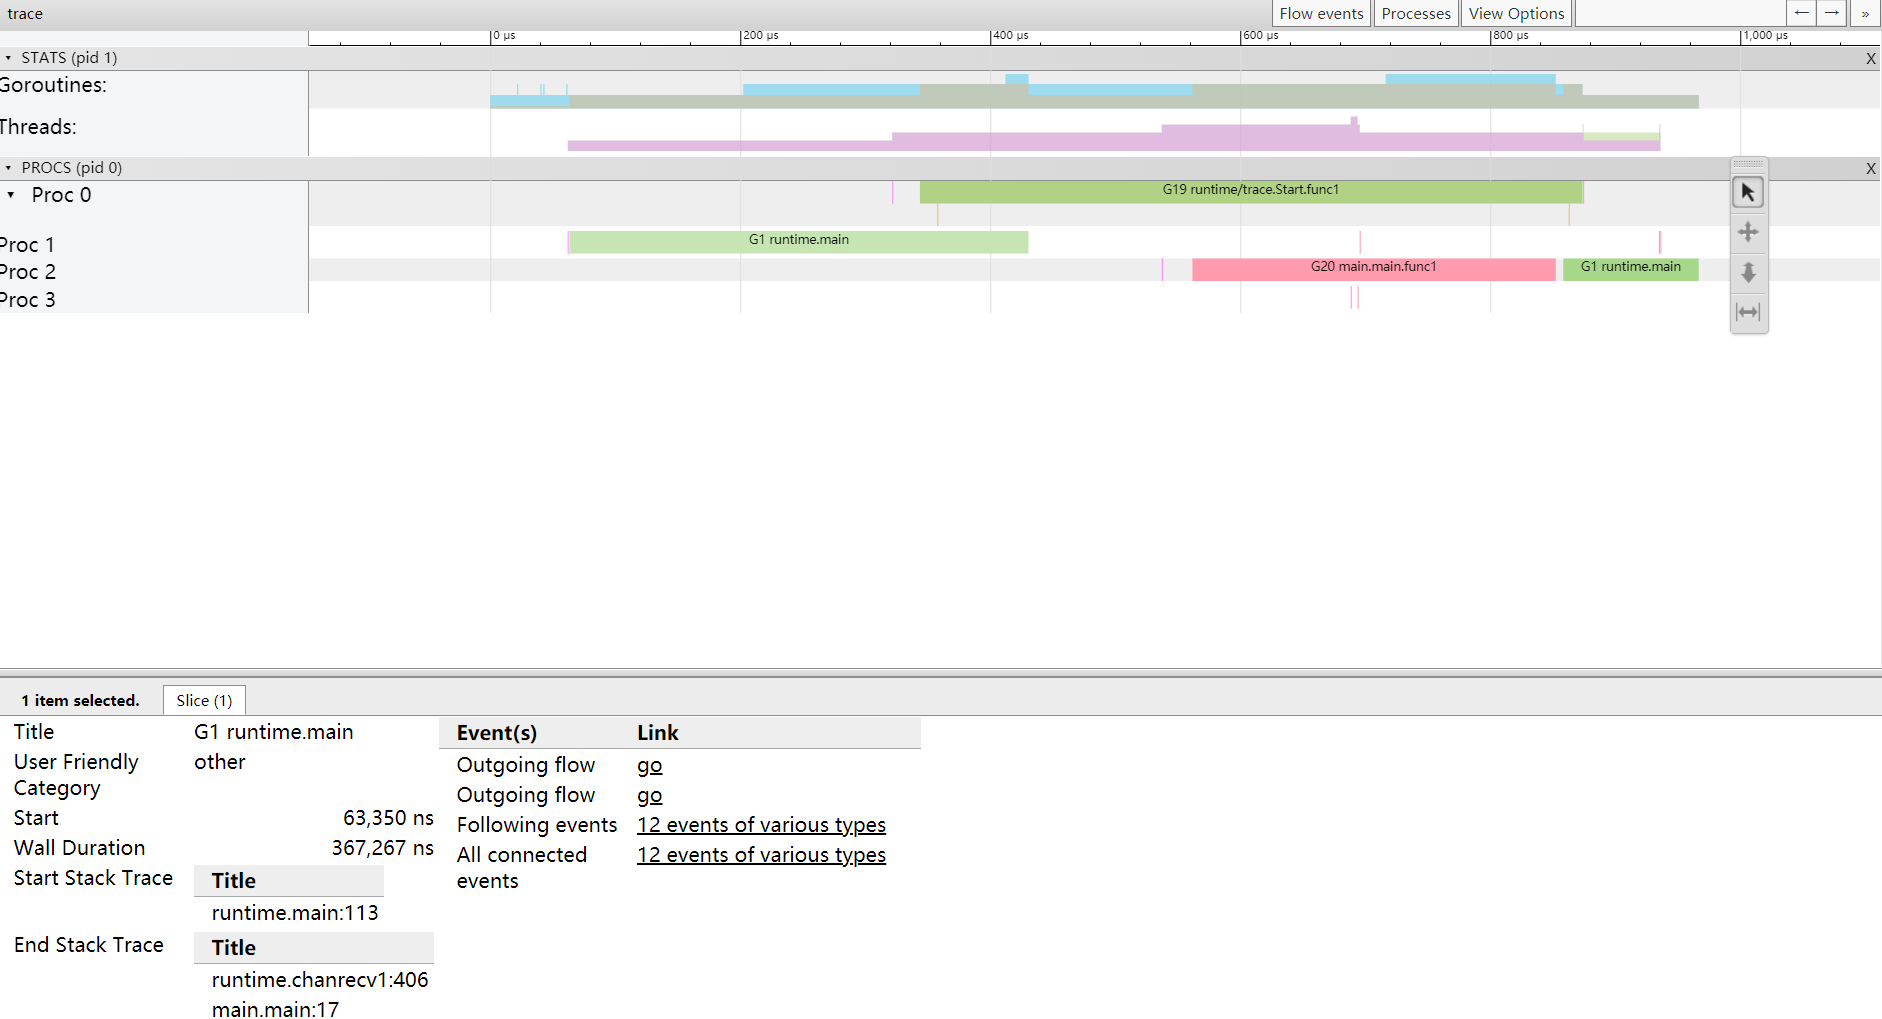

- 最上面的刻度表示时间线,如 0μs,200μs
- PROCS,P 的数量,由 GOMAXPROCS 控制。Proc 0,1,2,3 分别代表 4 个 P。后面对应的是每个 P 上执行的 goroutine。
点击具体的 goroutine 可以查看详细信息:
- Start:开始时间
- Wall Duration:持续时间
- Self Time:执行时间
- Start Stack Trace:开始时的堆栈信息
- End Stack Trace:结束时的堆栈信息
- Incoming flow:输入流
- Outgoing flow:输出流
- Preceding events:之前的事件
- Following events:之后的事件,可以在 View 中显示事件流。
- All connected:所有连接的事件
使用 GODEBUG
线下环境可以通过添加环境变量 GODEBUG='gctrace=1' 来跟踪打印垃圾回收器信息:
1 | GODEBUG='gctrace=1' go run main.go |
配置 gctrace=1,垃圾回收器在每次回收时汇总所回收内存的大小以及耗时,并将这些内容汇总成单行内容打印到标准错误输出中。
格式:gc # @#s #%: #+#+# ms clock, #+#/#/#+# ms cpu, #->#-># MB, # MB goal, # P
gc #,GC 次数的编号,每次 GC 时递增@#s,距离程序开始执行时的时间#%,GC 占用的执行时间百分比#+...+#,GC 使用的时间#->#-># MB,GC 开始,结束,以及当前活跃堆内存的大小,单位M# MB goal,全局堆内存大小# P,使用 processor 的数量
示例:gc 11 @1.985s 0%: 0+1.0+0 ms clock, 0+1.0/2.0/5.0+0 ms cpu, 4->4->0 MB, 5 MB goal, 8 P
gc 11:GC 编号 11@1.985s:程序执行时间 1.985s0%:1.985s 中 gc 占用了 0%0+1.0+0 ms clock:垃圾回收的时间,分别为 STW(stop-the-world)清扫的时间 + 并发标记和扫描的时间 + STW 标记的时间0+1.0/2.0/5.0+0 ms cpu:垃圾回收占用的 cpu 时间4->4->0 MB:GC 开始前堆内存 4M, GC 结束后堆内存 4M,当前活跃的堆内存 0M5 MB goal:全局堆内存大小8 P:本次 GC 使用了 8 个 P
使用 trace 包
1 | package main |
go run main.go 2> trace.out 生成 trace 文件。通过 go tool trace trace.out,查看 trace 信息。
本文引自这里
